At-risk learners report
The At-risk report lists learners trending toward failure or dropout. This article covers reading it and the intervention playbook.
Before you start
You need the Admin or Instructor role. The report needs at least a week of activity to produce useful signal.
Step 1 — Open the report
Open Configuration → Analytics and switch to the At-risk learners tab. Each learner appears with their risk score, the courses driving the risk, and their last-active timestamp.
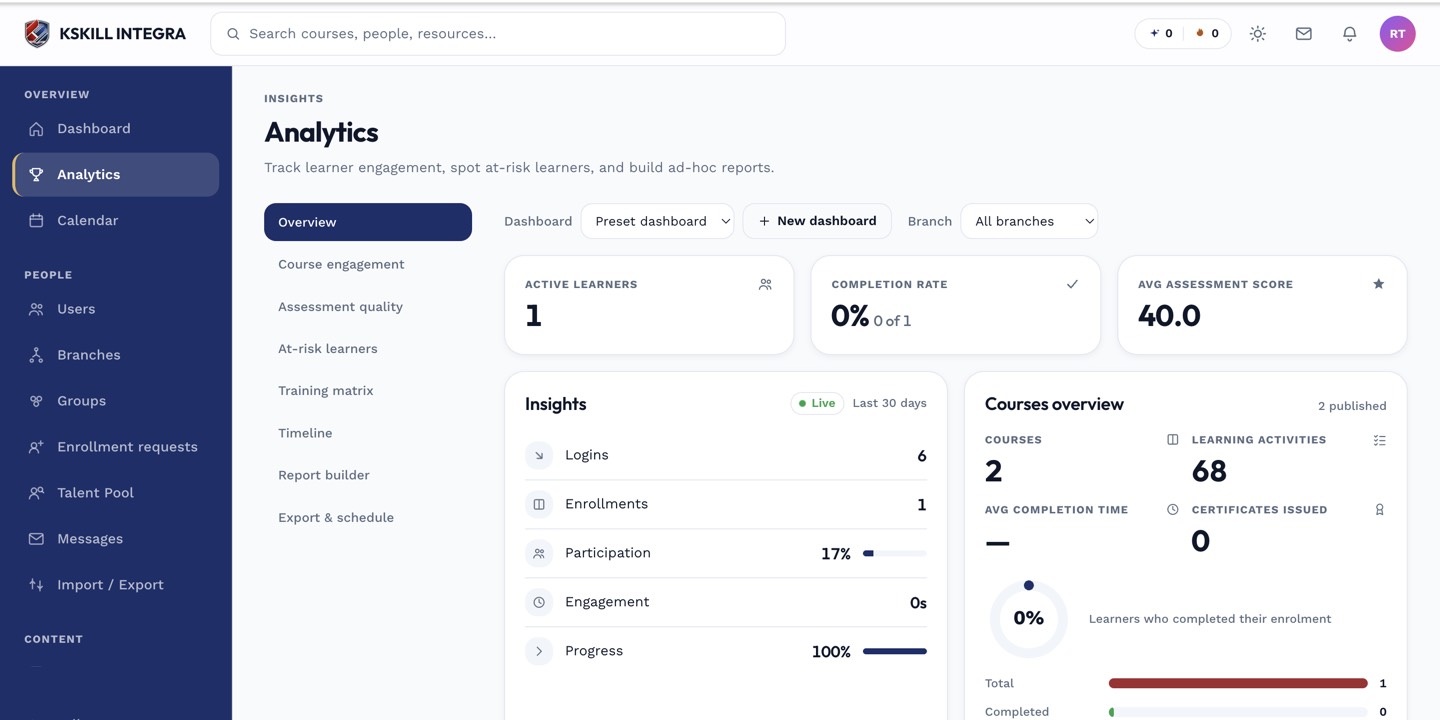
The Overview tab is the one everyone lives in — the deeper tabs answer sharper questions.
Step 2 — Read the risk signals
Common signals: no logins in 14 days, low completion pace vs cohort, failing assessment attempts. Click any learner row to open their profile and see the full picture. Look for a common cause across many learners before assuming it is personal.
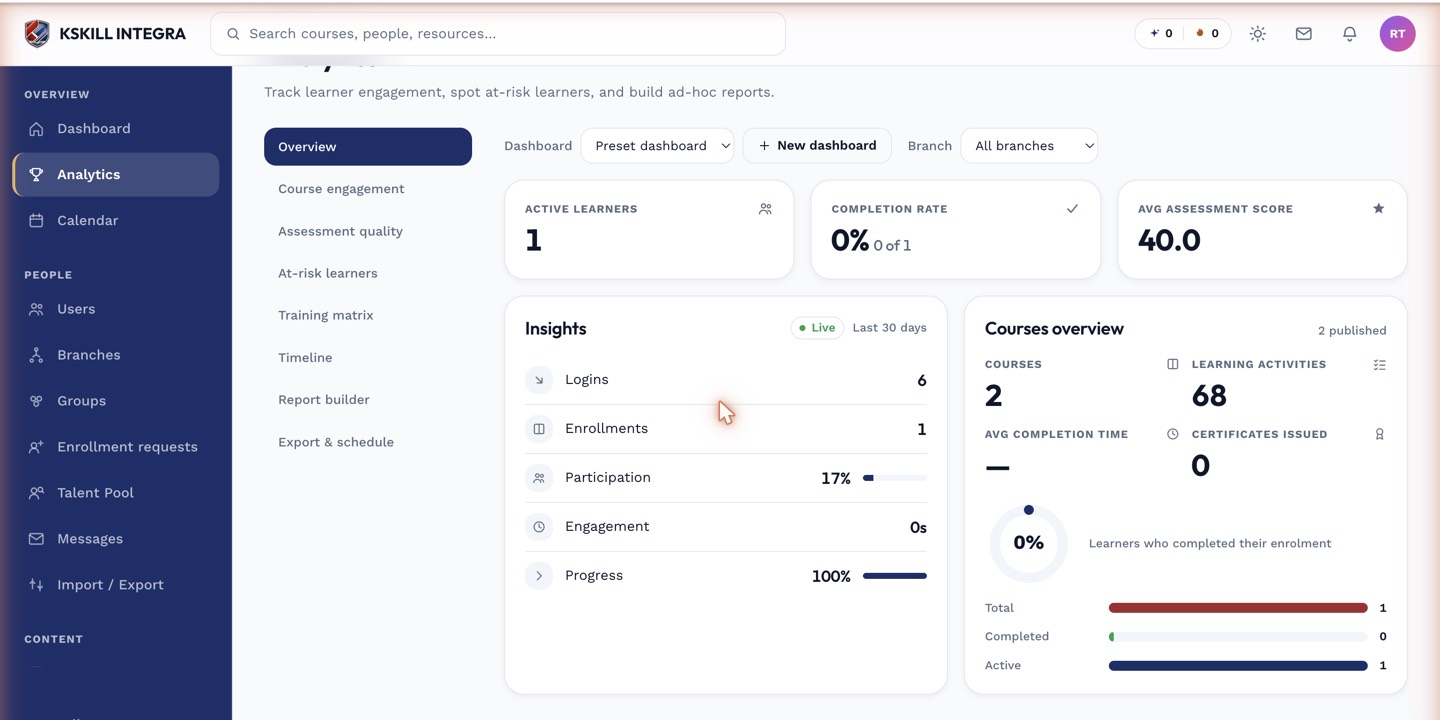
The detail panels give you the breakdown behind each KPI tile.
Step 3 — Intervene early
Message the learner from their profile with a specific offer of help. If several learners share a problem, escalate to the course author — the content or the pacing might be the root cause. Re-check the report next week to see who moved out of the red.
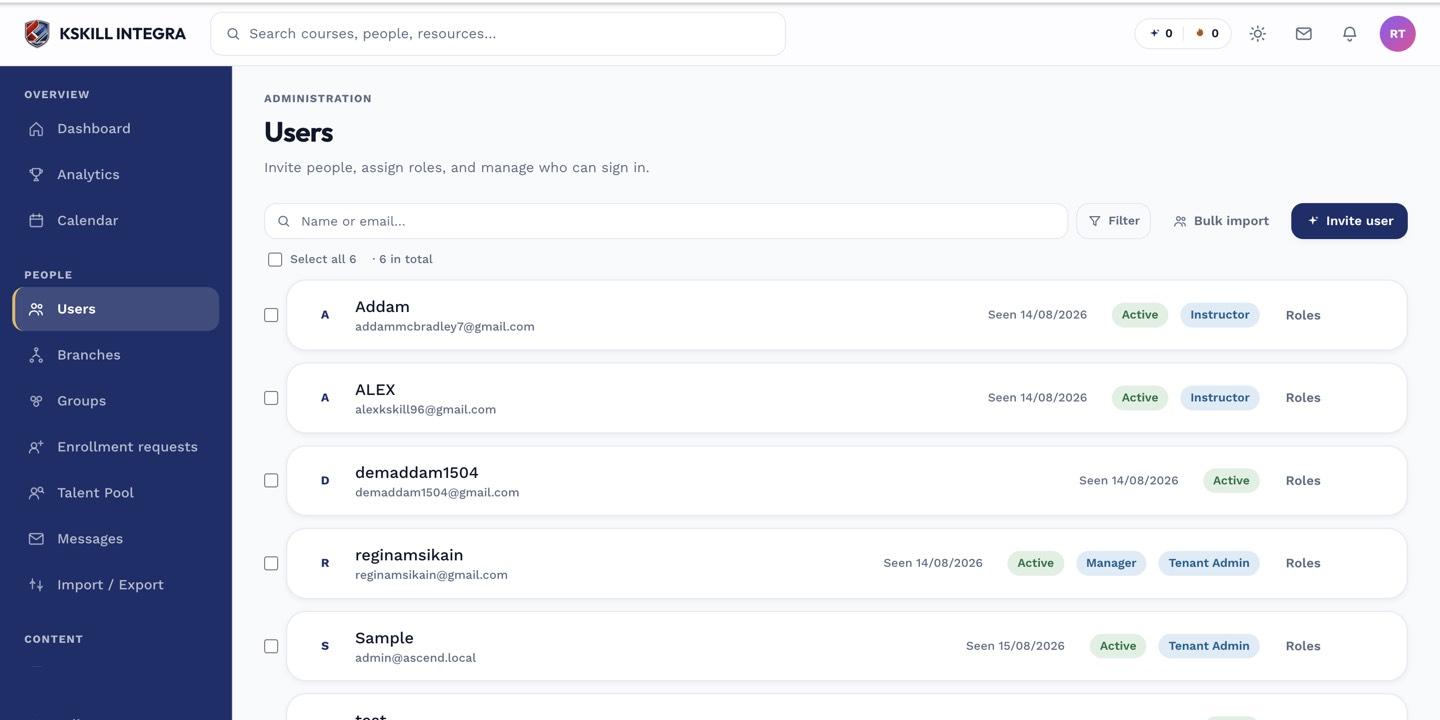
The Users list is the entry point for every person-related admin task.
Notes
- The risk model looks at trend, not absolute state — a slow but steady learner is not at risk.
- Cohort-scheduled courses show cohort-relative risk, not tenant-relative.