Read the analytics dashboard
Analytics answers three questions: who is learning, how well are they doing, and where are the gaps. This article walks through the Overview tab.
Before you start
You need the Admin or Instructor role. Instructors see only branches they belong to; admins see everything.
Step 1 — Open the dashboard
Open Configuration → Analytics. Use the Branch filter at the top right to narrow to one office, or leave it on All. Three KPI tiles cover active learners, completion rate and average assessment score for the selected window.
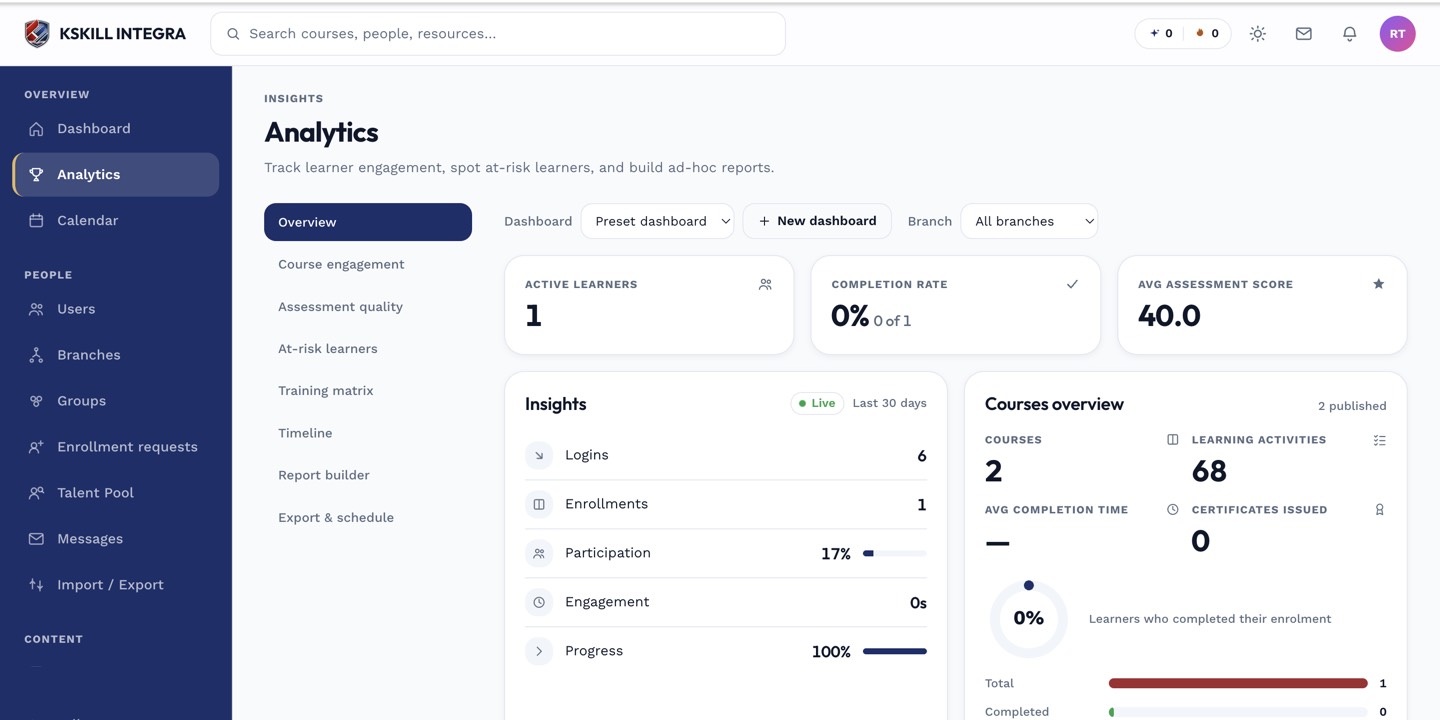
The Overview tab is the one everyone lives in — the deeper tabs answer sharper questions.
Step 2 — Read the detail panels
The Insights panel breaks each metric down by Logins, Enrolments, Participation, Engagement and Progress. The Courses overview panel counts Courses, Learning activities, Average completion time and Certificates issued. Both panels support CSV or PDF export from the icon top right.
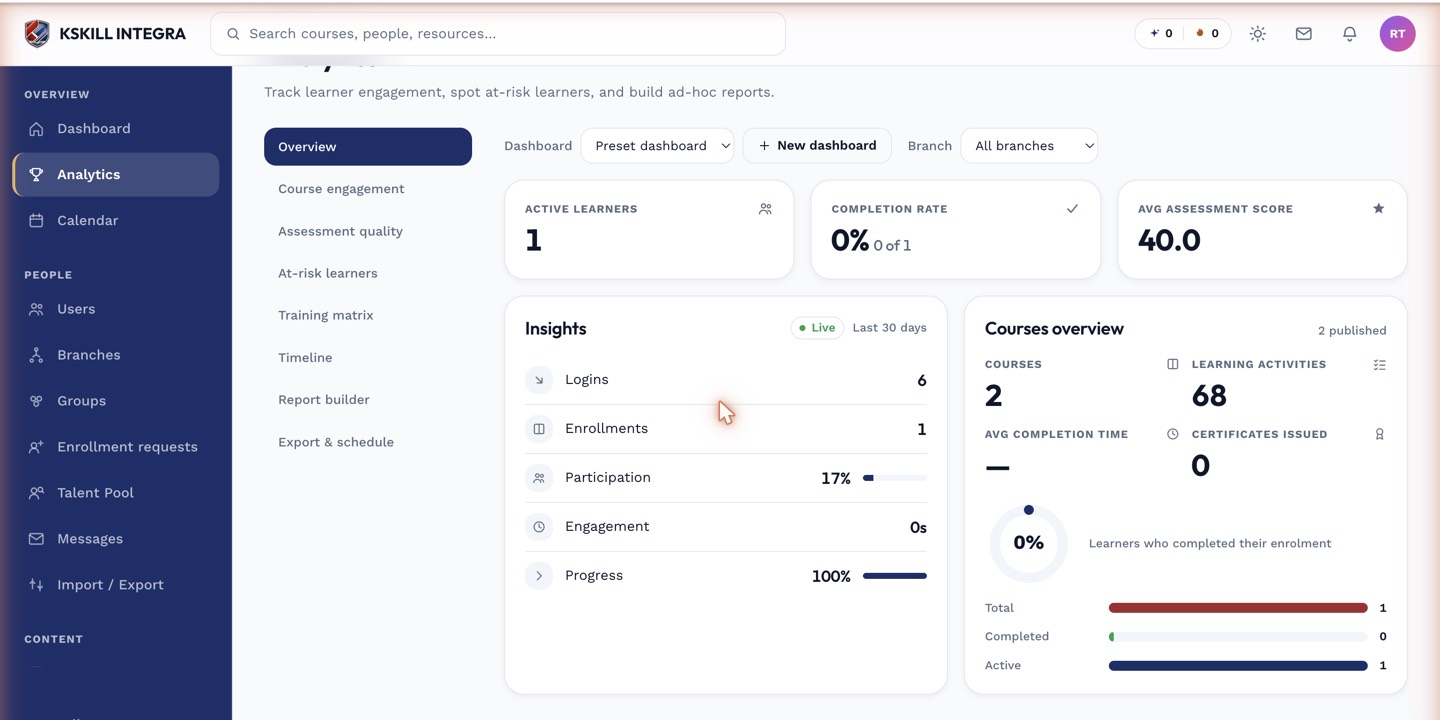
The detail panels give you the breakdown behind each KPI tile.
Step 3 — Go deeper on the sub-tabs
The other tabs answer sharper questions. Course engagement ranks courses by attention. Assessment quality flags questions that are too easy or too hard. At-risk learners lists users trending toward failure. Report builder and Export & schedule let you cut and mail a report on a recurring cadence.
The detail panels give you the breakdown behind each KPI tile.
Notes
- Export & schedule is how executives get a Monday-morning digest without ever signing in.
- Every panel exports independently as CSV or PDF from its top-right icon.